Grid Search V3-FIXED Results — Signal Deduplication (2016-2025)
Run date: 2026-03-18 Data range: 2016-01-01 to 2025-06-30 OOS split: 2024-01-01 CRITICAL FIX: cooldown_days=90 applied to all bottom_bounce signals
⚠️ Bug Fix: Signal Deduplication
이전 v3에서 Bottom Bounce 시그널이 바운스 조건이 충족되는 모든 날에 발생하여 거래 수가 ~30배 부풀려졌습니다. cooldown_days=90을 적용하여 같은 종목에 최소 90일 간격으로만 시그널이 발생하도록 수정했습니다.
- BB20 시그널 (cooldown 적용): 5599개
- BB30 시그널 (cooldown 적용): 4453개
- 쿨다운 위반: BB20=0, BB30=0
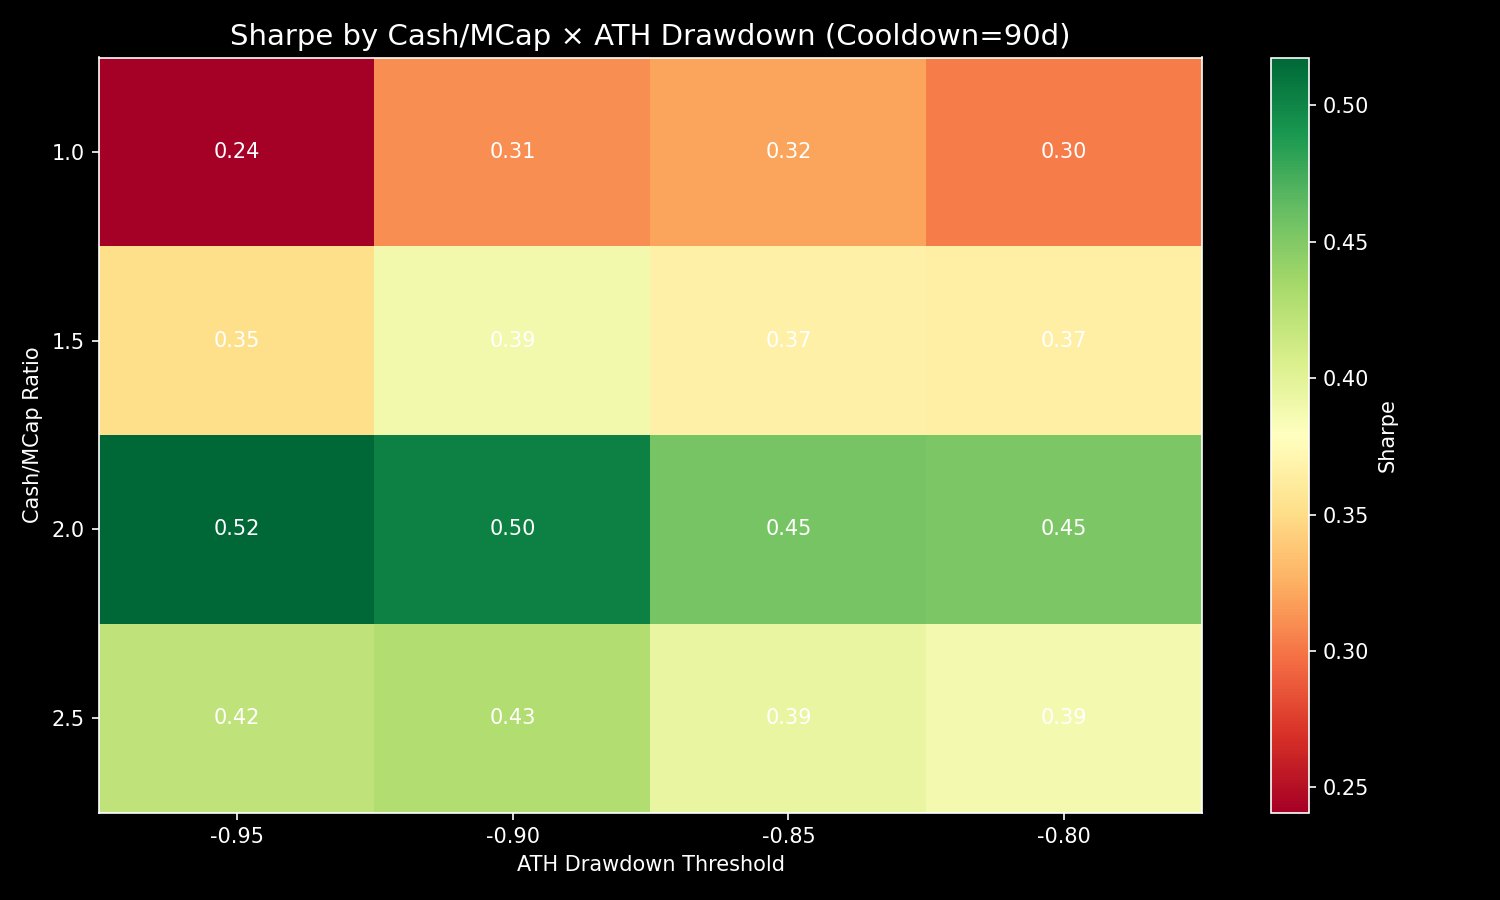
Stage 1: Universe Filter Sweep
- Total combos tested: 512
- Valid combos (≥30 trades): 462
Top 10 Universe Configs
| Rank | Cash/MCap | Runway Q | ATH DD | Phase | IPO Age | Min MCap | Trades | Mean Ret | Win Rate | Sharpe |
|---|---|---|---|---|---|---|---|---|---|---|
| 1 | 2.0 | 4 | -0.95 | Phase 2 | 2 | $10M | 35 | 46.6% | 71.4% | 0.757 |
| 2 | 2.0 | 4 | -0.95 | Phase 2 | 0 | $10M | 36 | 45.1% | 69.4% | 0.735 |
| 3 | 2.0 | 4 | -0.9 | Phase 2 | 2 | $10M | 41 | 44.9% | 70.7% | 0.714 |
| 4 | 2.0 | 0 | -0.95 | Phase 2 | 2 | $10M | 39 | 43.1% | 69.2% | 0.687 |
| 5 | 2.0 | 2 | -0.95 | Phase 2 | 2 | $10M | 39 | 43.1% | 69.2% | 0.687 |
| 6 | 2.0 | 4 | -0.85 | Phase 2 | 2 | $10M | 45 | 41.6% | 71.1% | 0.672 |
| 7 | 2.0 | 4 | -0.8 | Phase 2 | 2 | $10M | 45 | 41.6% | 71.1% | 0.672 |
| 8 | 2.0 | 2 | -0.95 | Phase 2 | 0 | $10M | 40 | 41.9% | 67.5% | 0.671 |
| 9 | 2.0 | 0 | -0.95 | Phase 2 | 0 | $10M | 40 | 41.9% | 67.5% | 0.671 |
| 10 | 2.0 | 0 | -0.9 | Phase 2 | 2 | $10M | 47 | 42.0% | 68.1% | 0.645 |
Stage 2: Entry × Exit Optimization
- Total strategy combos: 360
Top 10 Strategies
| Rank | Entry | TP | SL | MaxD | Trades | Mean Ret | Median | Win% | Sharpe | IS | OOS |
|---|---|---|---|---|---|---|---|---|---|---|---|
| 1 | bottom_bounce_20 | 0.5 | -0.5 | 365 | 39 | 45.4% | 55.5% | 79% | 0.891 | 45.4% | 45.3% |
| 2 | bottom_bounce_20 | 0.5 | -0.5 | 365 | 39 | 45.4% | 55.5% | 79% | 0.891 | 45.4% | 45.3% |
| 3 | bottom_bounce_30 | 0.5 | -0.7 | 365 | 39 | 44.1% | 54.5% | 82% | 0.878 | 39.2% | 52.1% |
| 4 | bottom_bounce_30 | 0.5 | -0.7 | 365 | 39 | 44.1% | 54.5% | 82% | 0.878 | 39.2% | 52.1% |
| 5 | bottom_bounce_20 | 0.5 | -0.5 | 365 | 36 | 44.9% | 55.9% | 78% | 0.862 | 46.8% | 41.5% |
| 6 | bottom_bounce_20 | 0.5 | -0.5 | 365 | 35 | 44.6% | 55.5% | 77% | 0.844 | 46.4% | 41.5% |
| 7 | bottom_bounce_20 | 1.0 | -0.7 | 365 | 41 | 68.0% | 105.0% | 73% | 0.841 | 71.8% | 61.6% |
| 8 | bottom_bounce_20 | 0.5 | -0.7 | 365 | 41 | 46.0% | 55.5% | 78% | 0.832 | 46.5% | 45.2% |
| 9 | bottom_bounce_20 | 0.5 | -0.5 | 180 | 36 | 39.5% | 53.1% | 75% | 0.831 | 43.9% | 31.7% |
| 10 | bottom_bounce_20 | 0.5 | -0.7 | 365 | 39 | 44.3% | 55.5% | 79% | 0.829 | 43.5% | 45.5% |
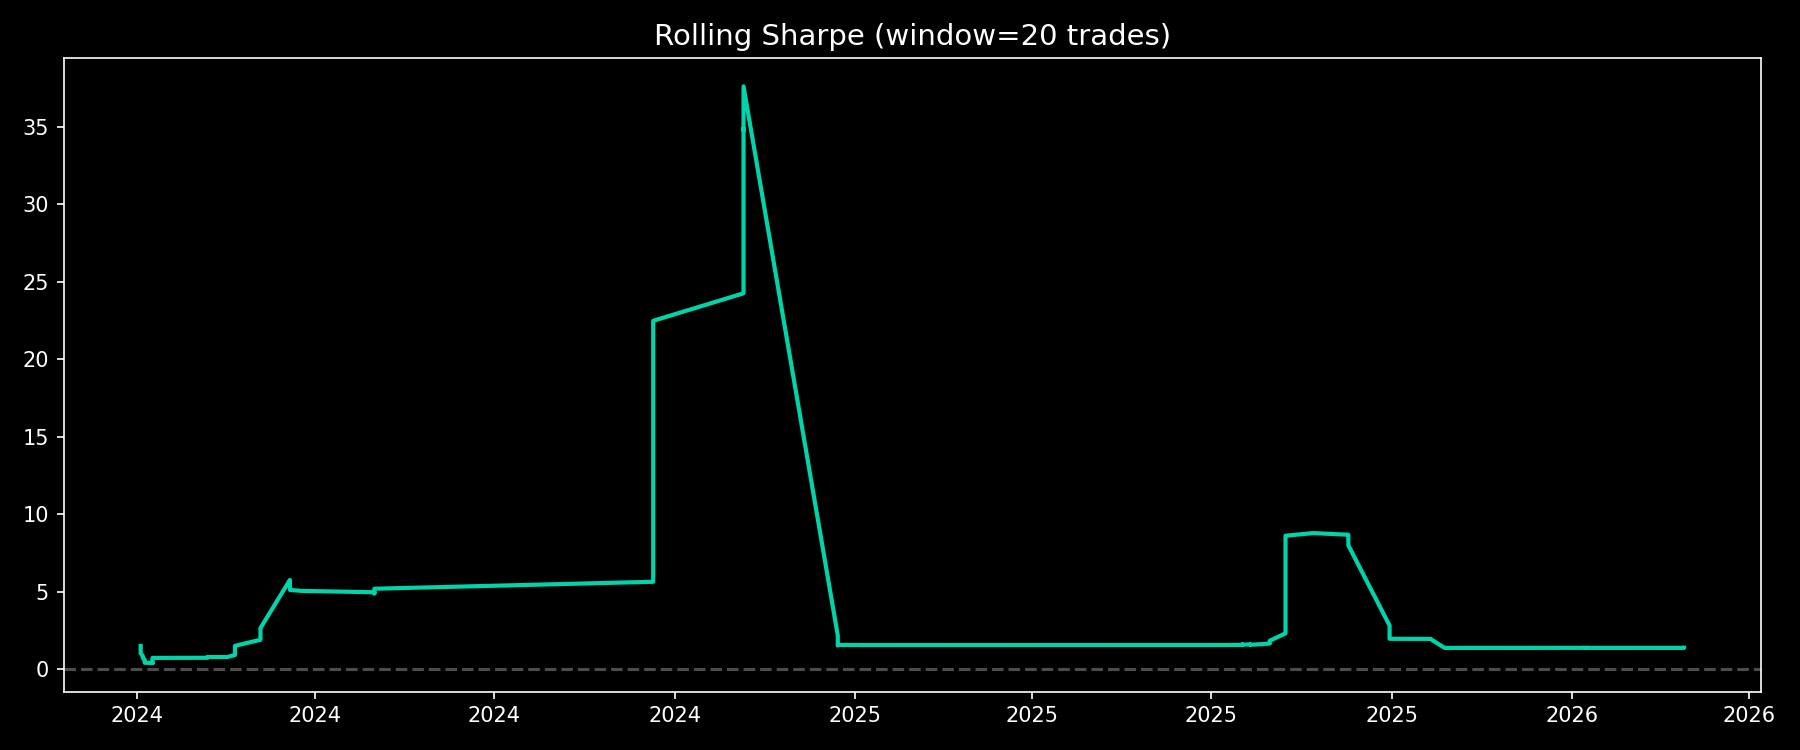
Stage 3: Portfolio Simulation (Top 3, Deduped)
Strategy #1
- Entry: bottom_bounce_20, TP=0.5, SL=-0.5, MaxDays=365
- Full period: 325.4% return, -9.4% max DD, 36 trades, $425,395
- In-sample: 143.9% return (22 trades)
- Out-of-sample: 75.1% return (14 trades)
Strategy #2
- Entry: bottom_bounce_20, TP=0.5, SL=-0.5, MaxDays=365
- Full period: 325.4% return, -9.4% max DD, 36 trades, $425,395
- In-sample: 143.9% return (22 trades)
- Out-of-sample: 75.1% return (14 trades)
Strategy #3
- Entry: bottom_bounce_30, TP=0.5, SL=-0.7, MaxDays=365
- Full period: 328.0% return, -7.0% max DD, 38 trades, $428,046
- In-sample: 130.8% return (24 trades)
- Out-of-sample: 86.0% return (14 trades)
Charts